Continued from part 3.
Third Hypothesis:
The calculation of diversity metrics from MQN properties provides diversity assessments that are comparable to those calculated from more complex (computationally intensive) sets of properties.
Methods
The multidimensional chemical space is reminiscent of search spaces in optimization problems. In drug discovery, the processes of target and lead identification and lead optimization can be conceptualized as a search through the chemical space in order to find a compound that optimizes the search criteria (in terms of rule of 5 compliance, target affinity, and other criteria relevant to successful drugs). Diversity metrics are widely employed when searching such search spaces in order to characterize the coverage of the space, and to ensure an appropriate balance between exploration of the overall search space and exploitation of specific promising regions. Such diversity metrics were applied to the MQN representation of libraries to assess its ability to represent diversity in comparison to more complex systems of representation.
A common method for assessing the structural similarity of molecules is through the use of metrics to compare structural fingerprints. Daylight fingerprints are an example of structural fingerprints used for this purpose; they are bit vectors that are constructed by hashing topological paths (along bonds) in the molecule. The Tanimoto similarity coefficient is a popular method for comparing such fingerprints [1]; it is defined in the following equation, where a is the number of 1s in the first vector, b is the number of 1s in the second vector, and c is the number of positions in the two vectors that both contain 1s:
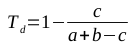
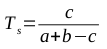 The Tanimoto similarity coefficient produces a number between 0 and 1, where 1 represents structurally identical molecules. In order to be useful as a distance metric (where similar molecules should have low numbers, representing their closeness), the value of Ts should be subtracted from 1, producing the Tanimoto dissimilarity coefficient defined in the following equation:
 As the Tanimoto coefficient is only useful for bit vectors, an alternative distance metric must be employed for vectors of MQNs. Manhattan distance (also called city block distance) is often used for integral vectors like MQNs [2, 3]; it is simply the sum of the absolute differences between the values of the properties.
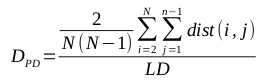
Diversity metrics have been widely employed to characterize populations in large search spaces in the field of evolutionary computation [4]. Four common diversity metrics were selected for purposes of comparison. Each diversity calculation is normalized to the landscape diagonal (LD), which represents the distance across the entire landscape (all of the molecules in the data set). This produces a number between 0 and 1, with a 1 indicating that the selected subset exhibits as much diversity as the entire set of molecules.
The mean of the distance between every member of the population and every other member is known to be a particularly effective metric, though it is computationally expensive (O(N^2), where N is the size of the population). The calculation of the mean of the pairwise distances, called PD, is defined by the following equation:
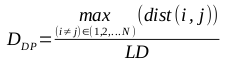
The greatest distance between any two members of the population is known as the diameter of the population, DP. It is an intuitive metric, but is very susceptible to the presence of outliers. The formula for calculating the diameter is defined by the following equation:
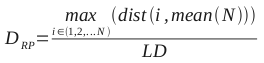
The distance between the mean of the population (also known as the center of gravity for the set of compounds) and the most distant member from the mean is the radius of the population, RP. This approach can be modified to exclude extreme individuals as outliers. The following equation shows the formula for calculating the radius:
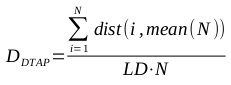
The average of the distances from the mean of the population to every member of the population is referred to as DTAP, the distance to the average point. This metric is defined by the following equation:
Diversity calculations from MQN representations (using a Manhattan distance metric) and Daylight fingerprint representations (using both Manhattan distance and Tanimoto dissimilarity coefficient metrics) were compared. High correlation among the representations can provide evidence that their abilities to characterize diversity are comparable.
Results
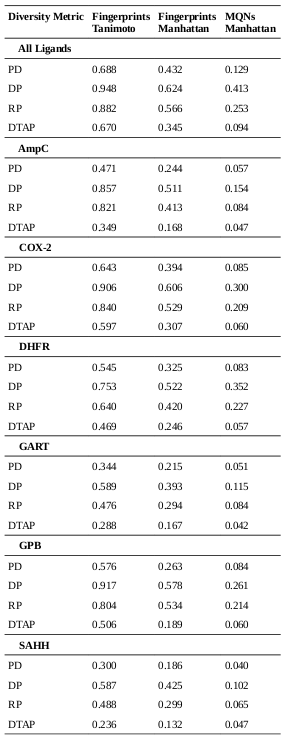
 The diversities of the ligands for each target were calculated, as well as the diversities of the overall set of all ligands. As described in the methods, the diversities are normalized against the landscape diagonal, which is the longest extent of the hypercube containing all of the downloaded molecules (ligands and decoys). The results of the diversity calculations are presented in the table on the right. It is not surprising that the diversity as measured by DP and RP (the diameters and radii of the populations) is always notably higher than the diversity produced by the other metrics, as DP and RP are particularly prone to the influence of outliers. In the case of RP, techniques have been developed to set aside the influence of extreme members of the population on the diversity [4]; such techniques were not explored in this study.
There is a very high correlation (Pearson’s correlation > 0.9) between the diversity measurements based on MQN properties and those based on fingerprints (using either Manhattan distances or Tanimoto coefficients as distance metrics). This suggests that the representations produced by both systems tend to vary by roughly the same proportion in response to variability in the data. It is interesting to note that the difference between diversities for larger sets in comparison to subsets is more substantial in the case of MQNs. When considering the ratio of the diversities of the target classes to the diversity of all ligands, the correlation among the representation methods is only moderate (about 0.5). This alone does not suggest that one method is more capable of representing diversity, but it does indicate that more descriptive data concerning molecular structure may be encoded in the MQN system.
The group of ligands for GPB provides an illustrative example. The use of Tanimoto coefficients with fingerprints indicates that this group represents over half of the structural diversity present in the entirety of the original set of ligands and decoys. It does not seem likely that a library designer would find that assessment to be convincing. In the case of the PD diversity metric, the use of MQN properties indicates that the ligands for GPB cover only 8% of the structural diversity present in the overall set.
References:
- Dean PM and Lewis RA, Eds. 2000. Molecular Diversity in Drug Design. Springer. Print.
- Reymond JL, Blum LC, and van Deursen R. 2011. Exploring the chemical space of known and unknown organic small molecules at http://www.gdb.unibe.ch. Chimia (Aarau) 65(11): 863-867.
- van Deursen R, Blum LC, and Reymond JL. 2011. Visualization of the chemical space of fragments, lead-like and drug-like molecules in PubChem. J Comput Aided Mol Des 25: 649-662.
- Corriveau G, Guilbault R, Tahan A, and Sabourin R. 2012. Review and study of genotypic diversity measures for real-coded representations. IEEE Transactions on Evolutionary Computation, 16(5): 695–710.