Continued from part 2.
Second Hypothesis:
Effective models can be constructed to predict possible target families for novel small molecules based solely on MQN representations.
Methods
Classifiers were used to construct predictive models. Ligands for the targets were used for the first six classes, and a seventh class consisting only of decoys was included to establish the ability to distinguish between compounds that exhibit activity with the various targets and those that do not exhibit activity for any of them. Classifiers were constructed using the following approaches:
- classification and regression trees (CART);
- linear and quadratic discriminant analysis (LDA and QDA);
- support vector machines (SVMs); and
- neural networks (NNs).
These classifiers were implemented in the R statistical programming language.
The practice of reducing the dimensionality of the space via the identification of significant combinations of properties is widely employed to yield more effective classification. The classifiers were applied both to untransformed data, and to data that were dimensionally reduced using the following techniques:
- PCA, using the top 3 and top 10 loadings;
- Kernel PCA based on a radial basis function (RBF) kernel;
- Classical metric multidimensional scaling (MDS);
- Kruskal’s non-metric MDS; and
- the weighted graph Laplacian (WGL), using the top 3 and 10 phis.
The efficacy of the classifiers was substantiated through the use of 5 x 2 cross-validation, in which multiple rounds of validation are performed with different partitions of the data, and the results are averaged across the rounds. Both precision (the measure of how accurate the positive classifications are) and recall (the accuracy of the samples that should have been classified as positive) are important characteristics in such models. These were calculated using the following equations, where tp is the number of true positives, fp is the number of false positives, and fn is the number of false negatives:
In order to provide a single metric for comparing predictive models, the F1 measure was used to provide a harmonic mean of precision and recall (assuming an equal importance in the two metrics), as defined in the following equation:
Results
Comparisons of the F1 measures for the various combinations of classifiers and input space transformations are shown in the following table:
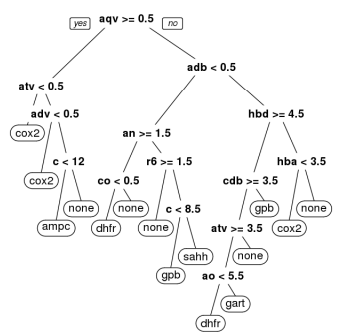
Random guessing yields an F measure of 0.342, assuming the guesser knows the set sizes (which serves to reduce the impact of bias). Among the evaluated classification approaches, CART provides the unique advantage of producing human-understandable decision trees; one such tree is presented in the following figure:
It is particularly interesting and perhaps unexpected that the various data transformation approaches did not produce gains in precision or recall in comparison to the untransformed data set. The classifiers based on neural networks and support vector machines performed particularly well with the untransformed data, both yielding F measures over 0.9; the decision tree and linear discriminant analysis techniques both produced F measures exceeding 0.8.
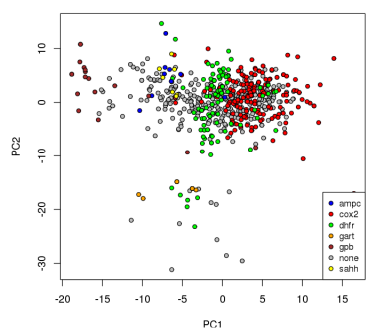
 A plot of points corresponding to ligands for the various groups based on the first two principal components obtained from PCA is presented in the figure on the right. These components account for 65.2% of the variability in the MQN properties among the targets. Prior studies indicate that the first principal component is often reflective of the size of the molecules [1]. The first component in this analysis clearly includes large contributions from other properties; while the smaller GPB ligands tend to have low values for that component, the ligands for GART (which are the largest molecules on average) appear in the middle. While finding the combinations of properties that result in the most variability is the goal of PCA, the first two components do not provide enough evidence to effectively separate the ligands. It is clear from the results that even 10 components do not provide sufficiently separability for the classifiers. This pattern is repeated for the other dimensionality reduction techniques, suggesting that such techniques are not effective for the development of classifiers for MQN-space.
Post-Mortem Comments
Reviewing this work in hindsight, there are a number of modifications I would have made to the methods.
The F1 metric is usually used in information retrieval scenarios, in which the true negative rate is less important. As such, I would have used a different metric, such as the Matthews correlation coefficient, or a metric based on confusion entropy [2].
Rather than building 7-class classifiers, I would have used either binary classifiers (one for each target, proving the ability to differentiate among known ligands for a particular target and decoys for that target) or one-class classifiers (again, one for each target). Such an approach would be more reflective of real-world analysis, in which one is interested in identifying the compounds that may exhibit activity with a target of interest. I suspect this would have changed the conclusions with respect to data reduction methods, as PCA (or other techniques) would have readily identified the combinations of variables relevant to the specific target.
There are sometimes vast differences in the class sizes; these differences were not rigorously addressed. A mixture of oversampling of minority classes and undersampling of majority classes was undertaken, depending on the class sizes. The use of cross-validation may help to correct majority-class preferences that might have been introduced, but a method for sampling based on the imbalance ratio would have been useful to devise.
References:
- Nguyen KT, Blum LC, van Deursen R, and Reymond JL. 2009. Classification of organic molecules by molecular quantum numbers. ChemMedChem 4(11): 1803-1805.
- Wei JM, Yuan XJ, Hu QH, and Wang SQ. 2010. A novel measure for evaluating classifiers. Expert Systems with Applications 37: 3799-3809.


